top of page

DATE:
INSTITUTE:
COURSE:
SKILLS:
Fall 2025
Duke University Pratt School of Engineering
Introduction to Rheology
• 3D CAD Modeling (SolidWorks)
• Computational Fluid Dynamics (Flow Simulation)
• TRIOS Software (lab rheometer measurements)
• Data Analysis & Graph Modeling
Project Overview
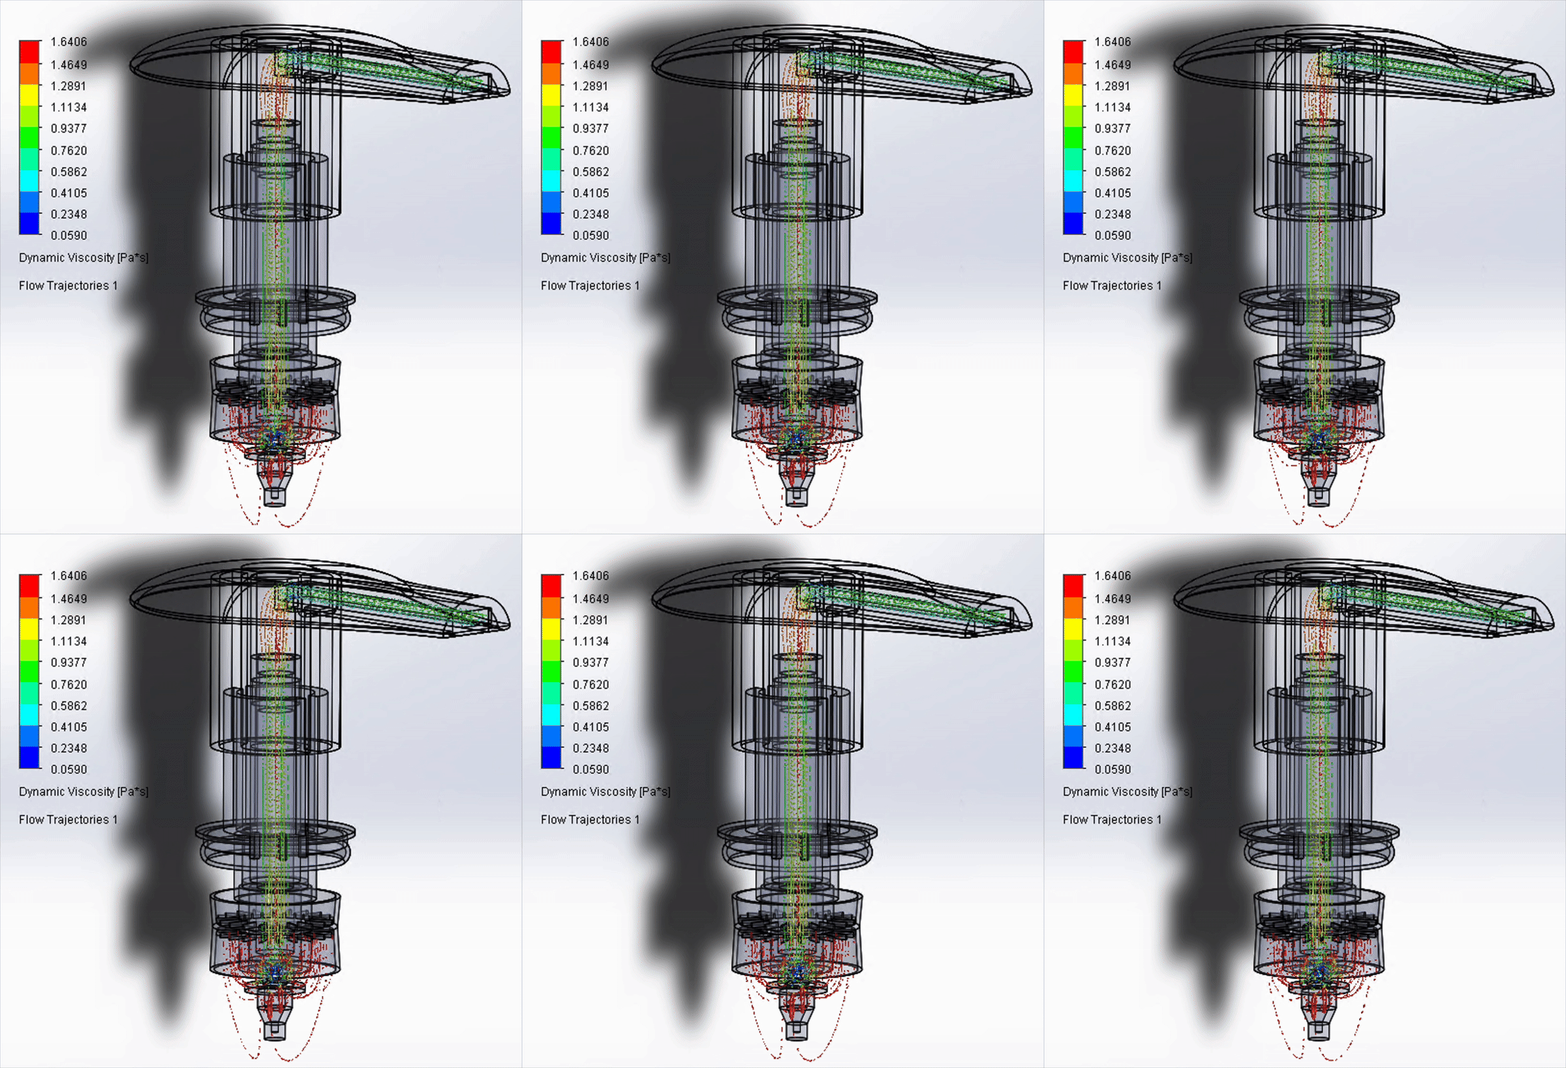
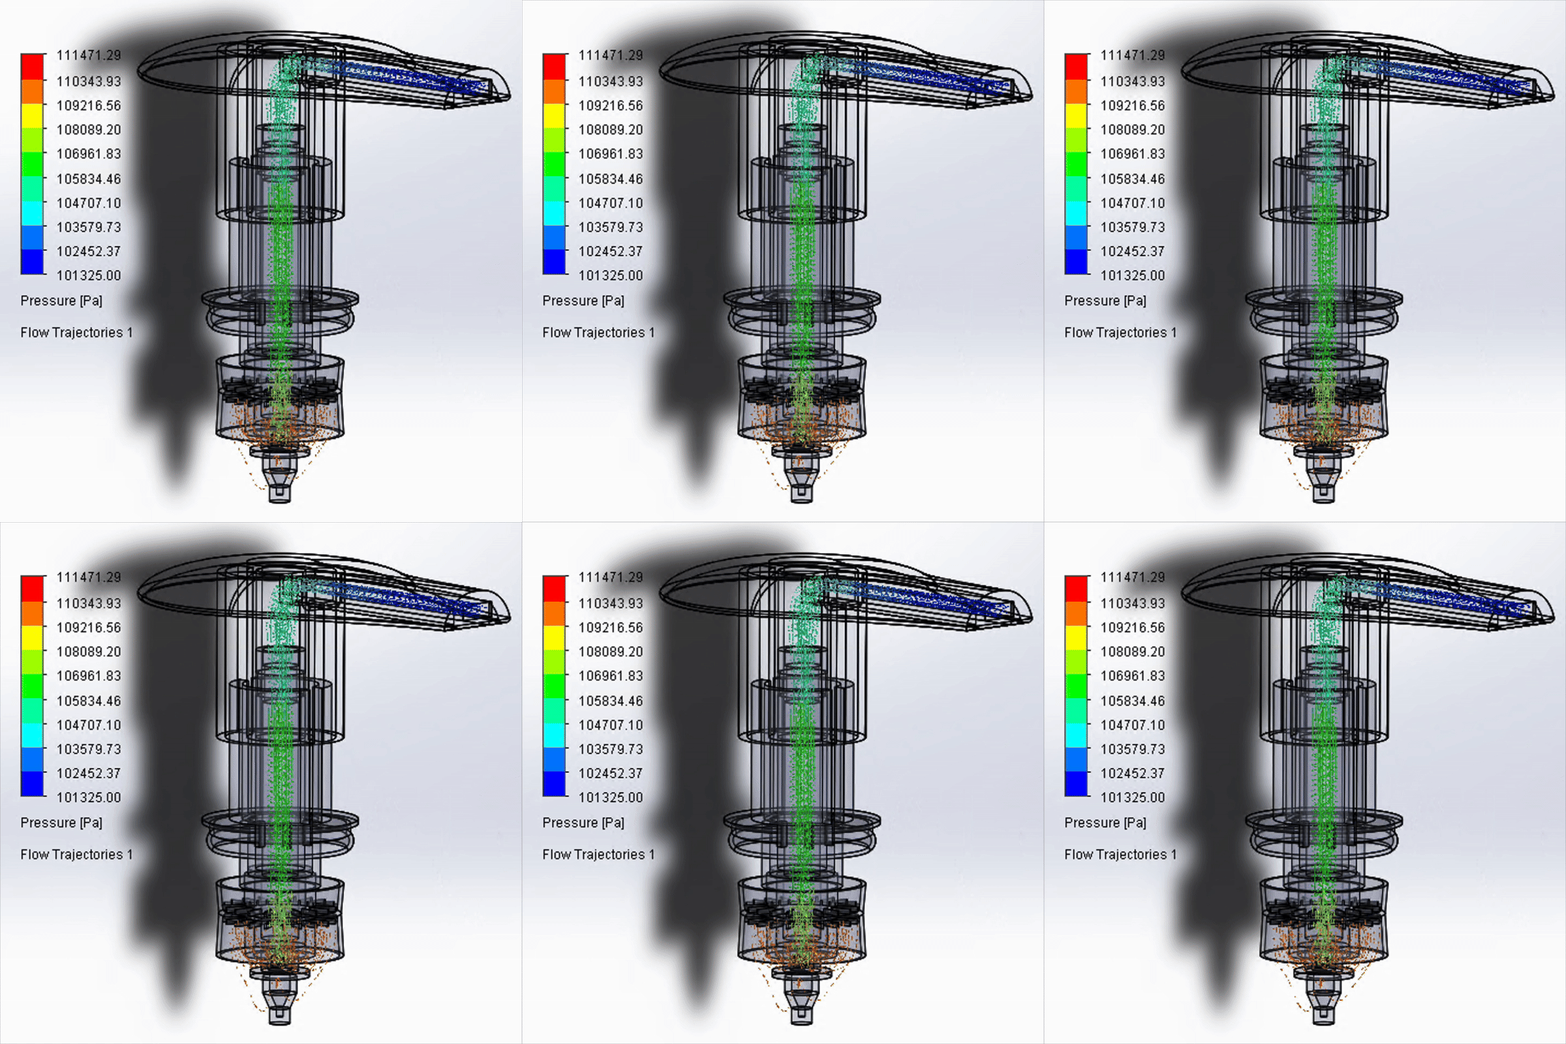
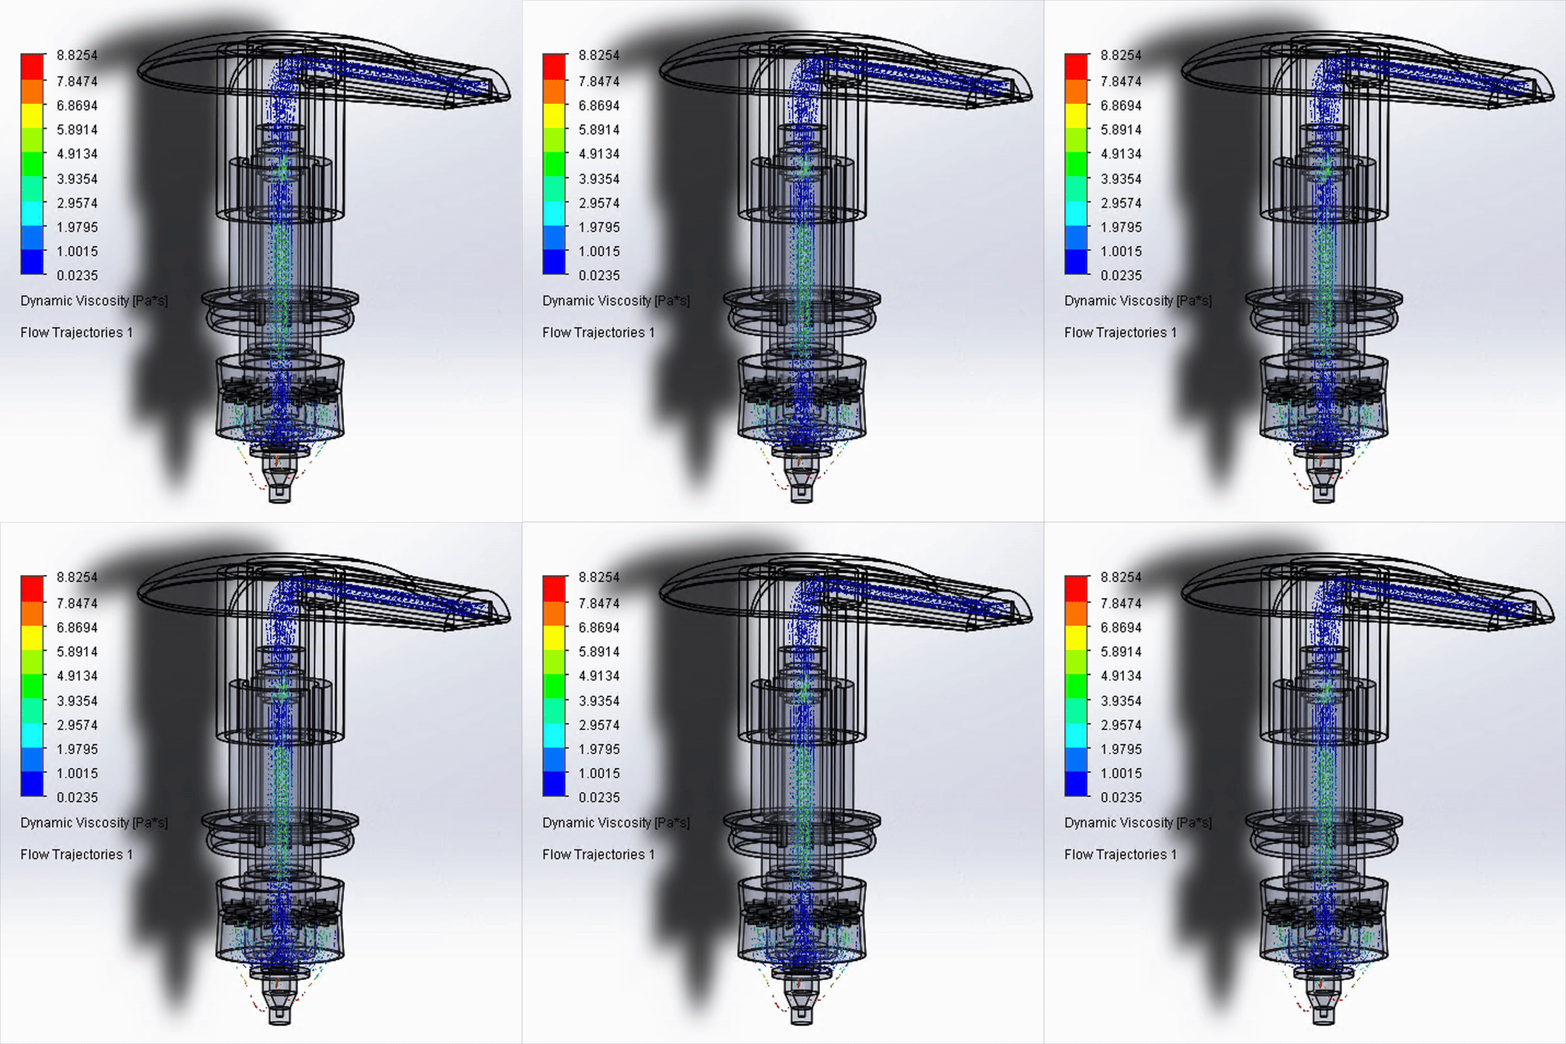
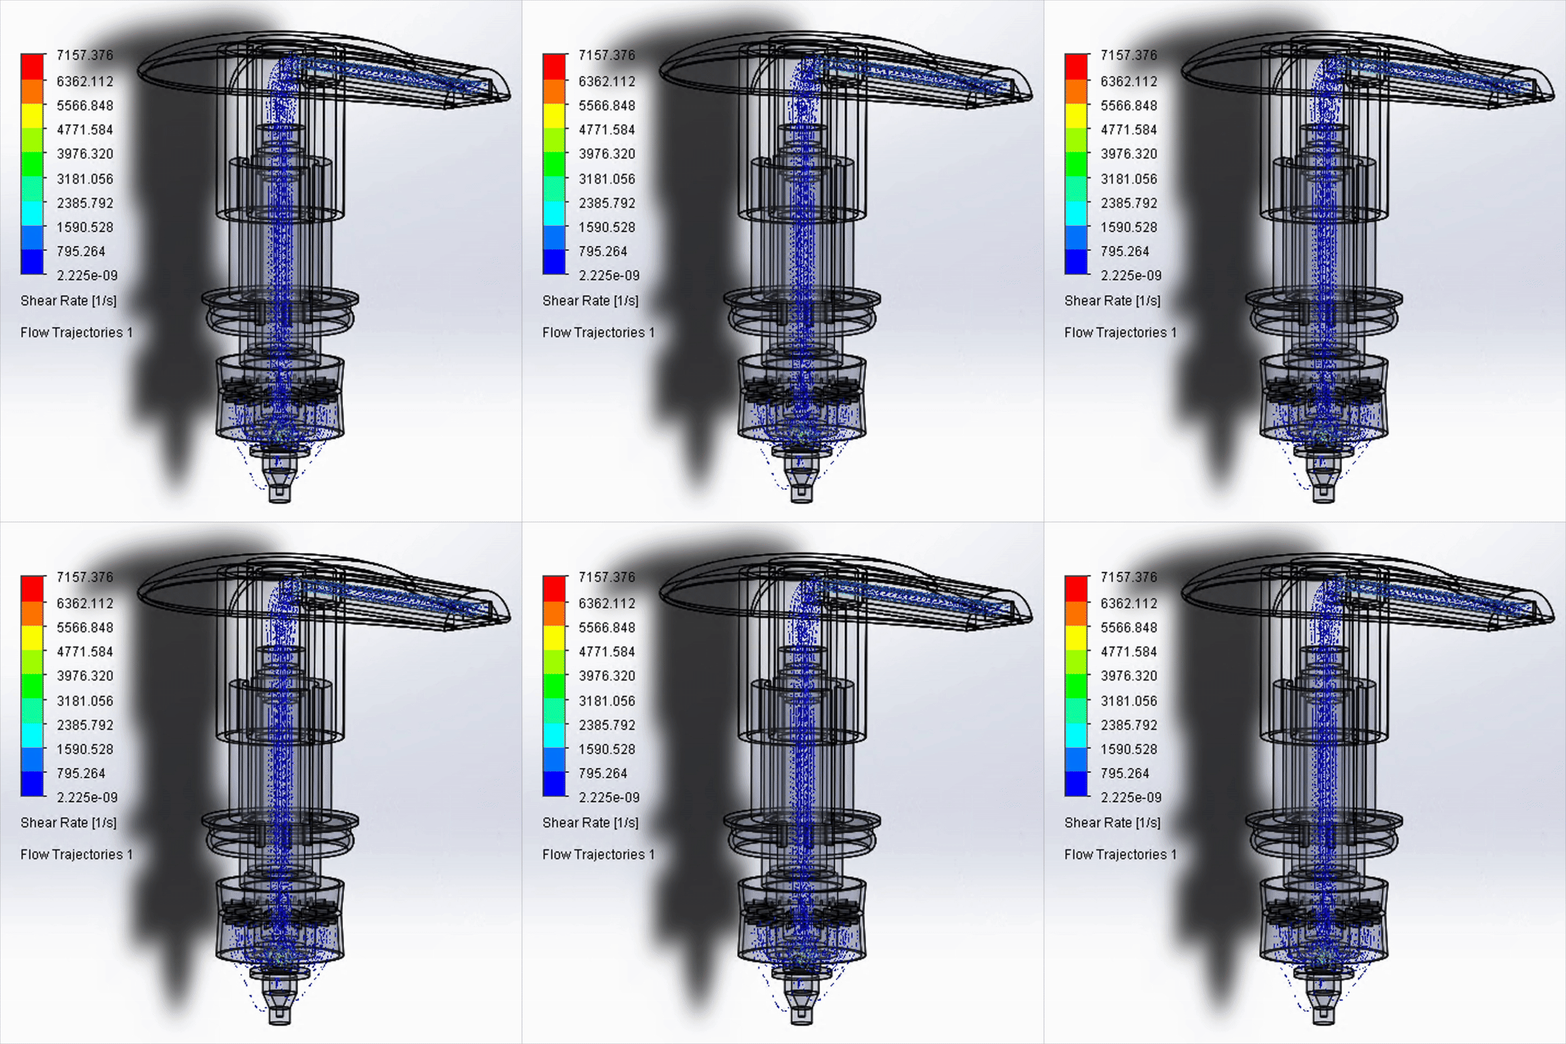
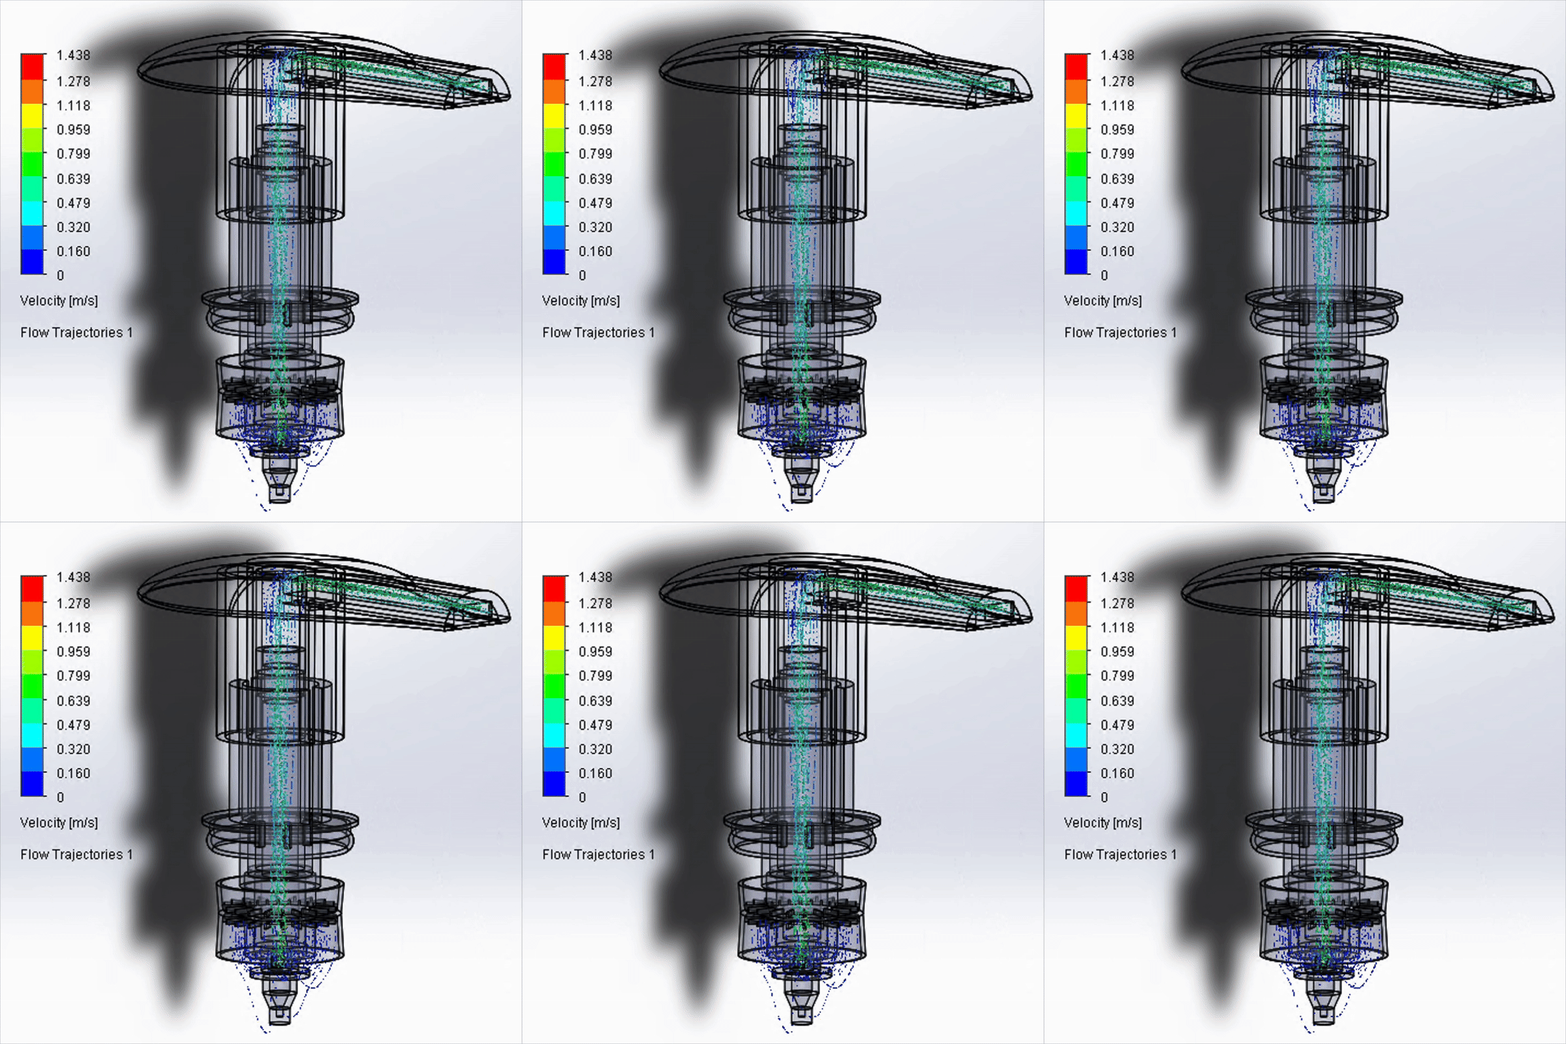
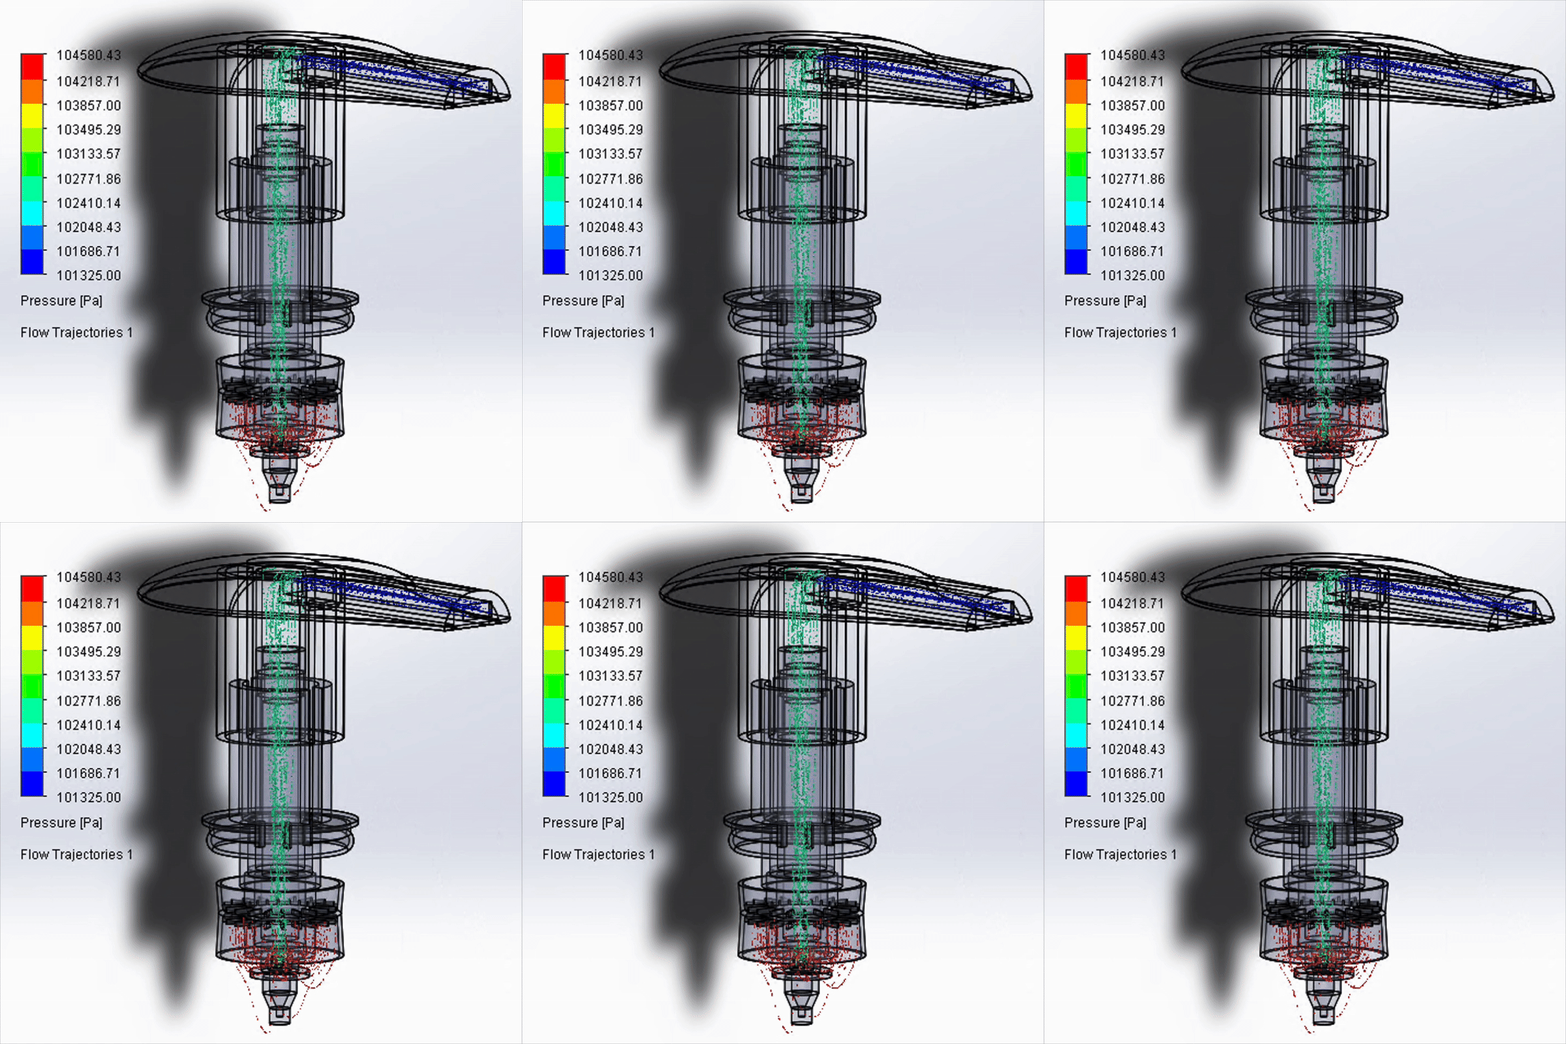
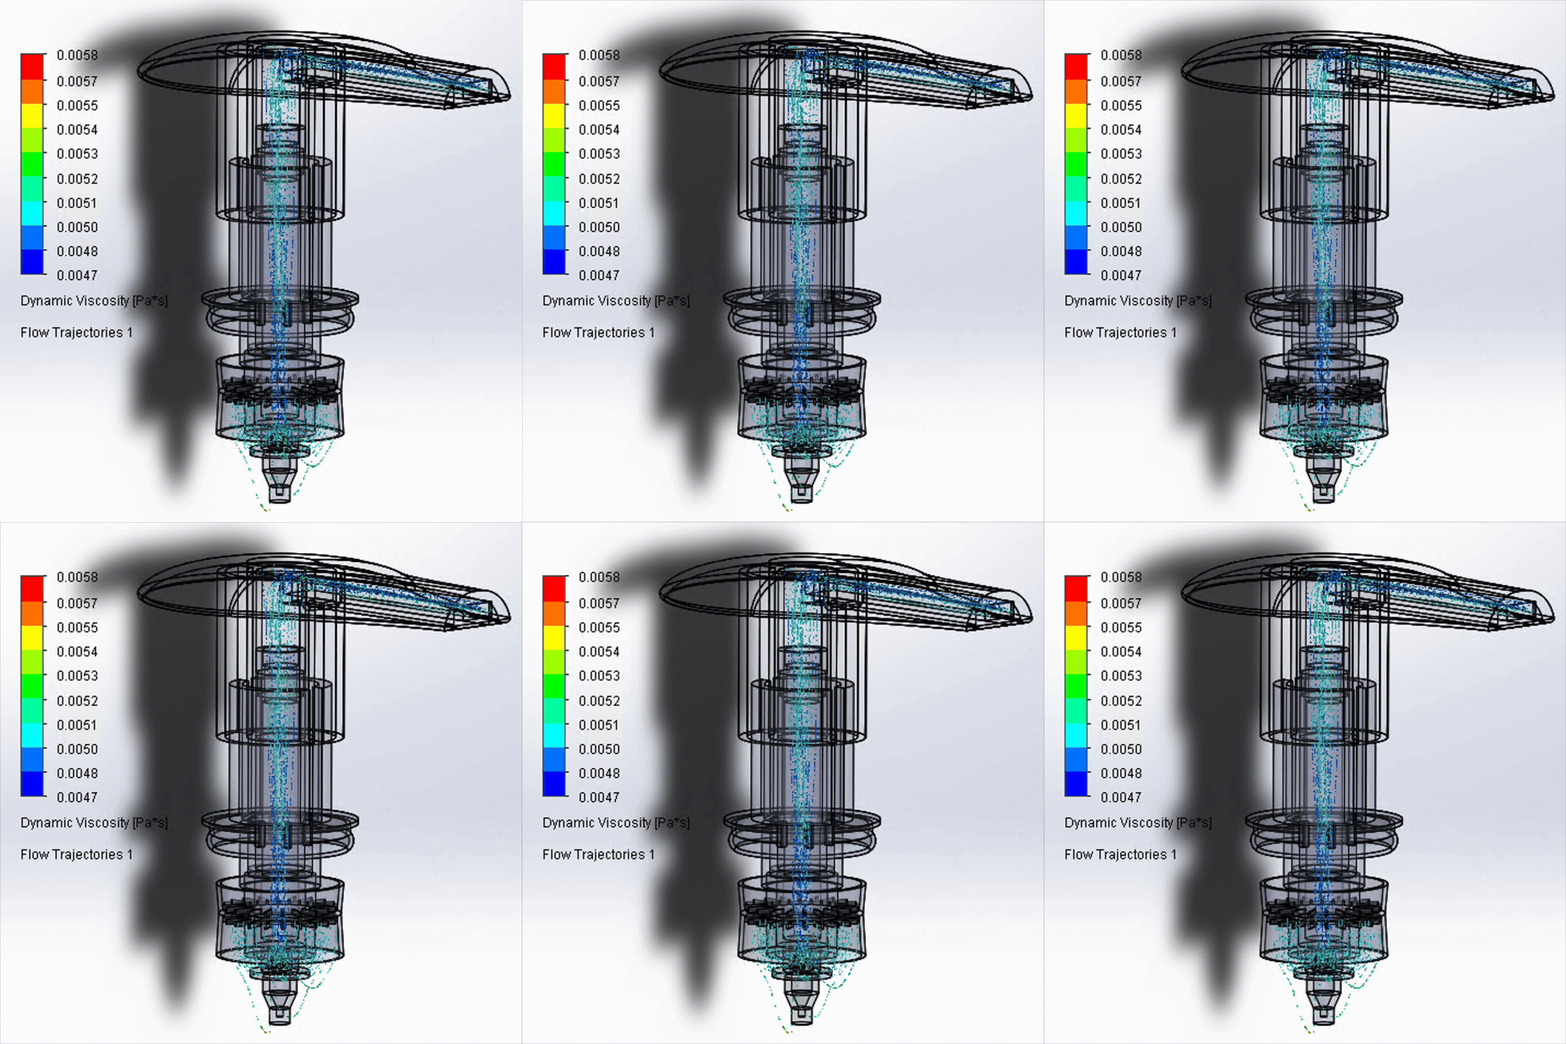
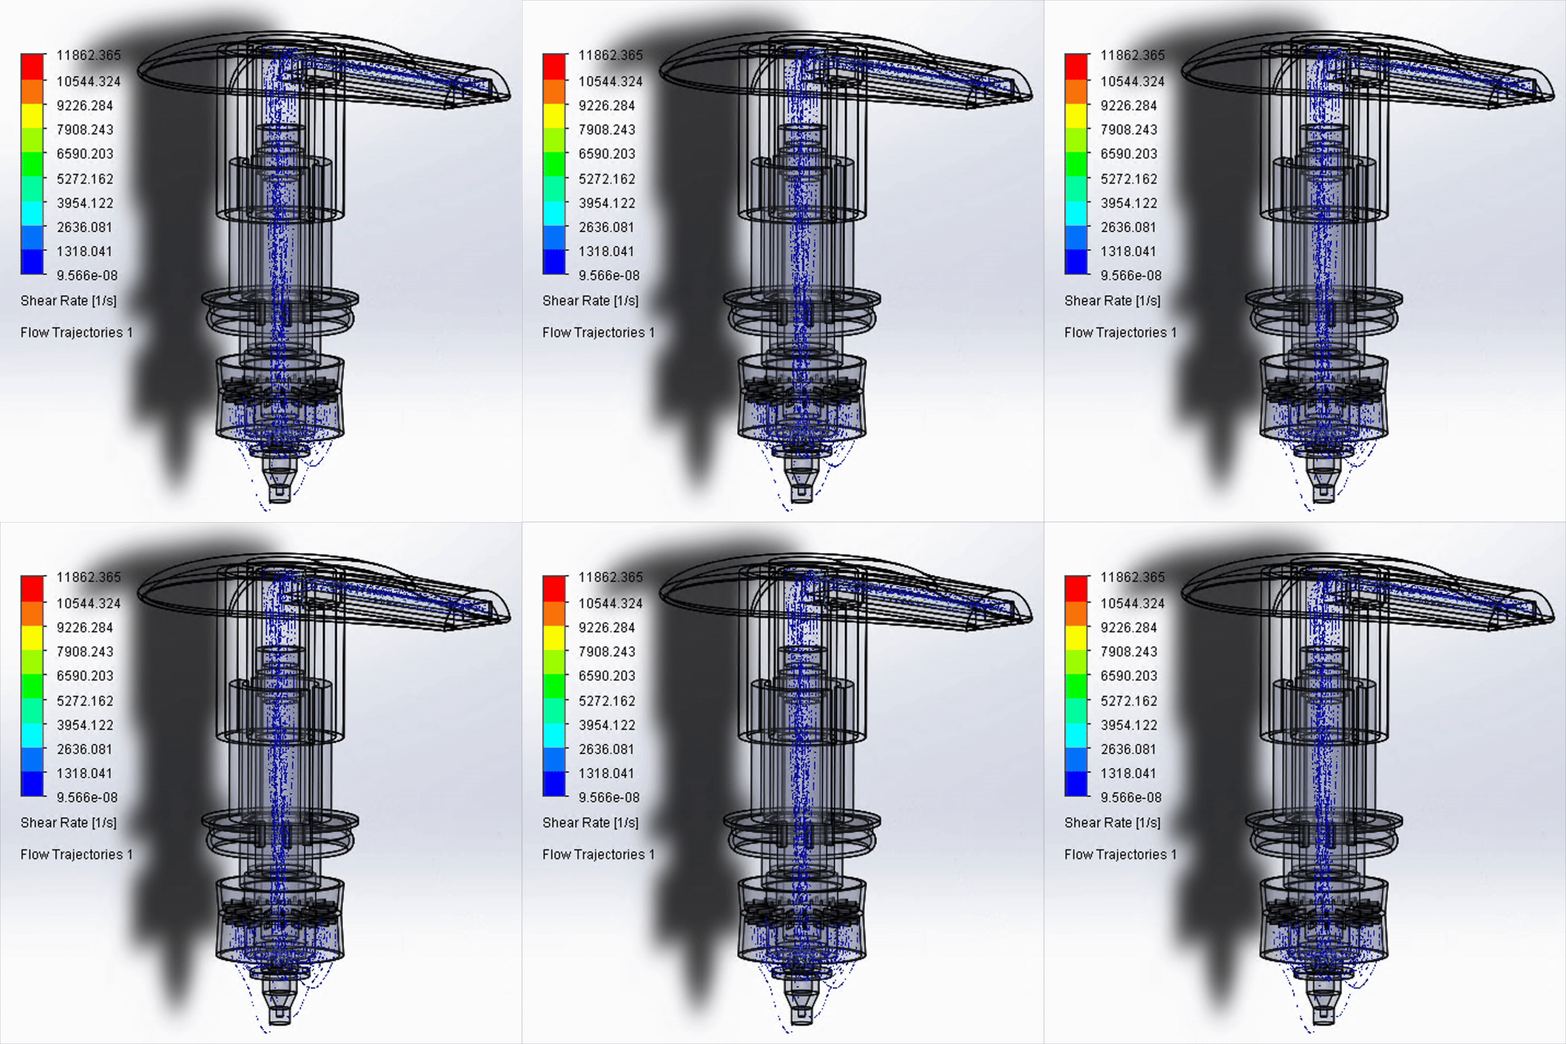
This study investigates how the rheological properties of three commercial liquid soaps influence their performance within a standard consumer soap dispenser. Rheometer testing was conducted to characterize each soap’s viscosity, shear-thinning behavior, and overall flow profile. These results were integrated into a CFD analysis in SolidWorks Flow Simulation using an original CAD soap dispenser creation as the geometry governing the flow trajectory. The CFD analysis evaluated pressure distribution, shear rate, and viscosity changes under flow for a fixed inlet velocity representing typical pumping conditions. Resulting actuation force was derived from pressure drop and the geometrical dimensions of the CAD model. The findings reveal substantial performance differences in the liquid soaps due to formulation chemistry.
Background: Soap Formulation and Micelle Structure
Liquid soaps are structured fluids composed of surfactants, water, electrolytes, and fragrances that modify viscosity. Surfactants spontaneously assemble into micelles, whose size, packing, and shape determine the fluid’s resistance to flow. Small, freely moving micelles have low viscosity and Newtonian-like behavior, while large, elongated micelles have increased viscosity and are shear-thinning.
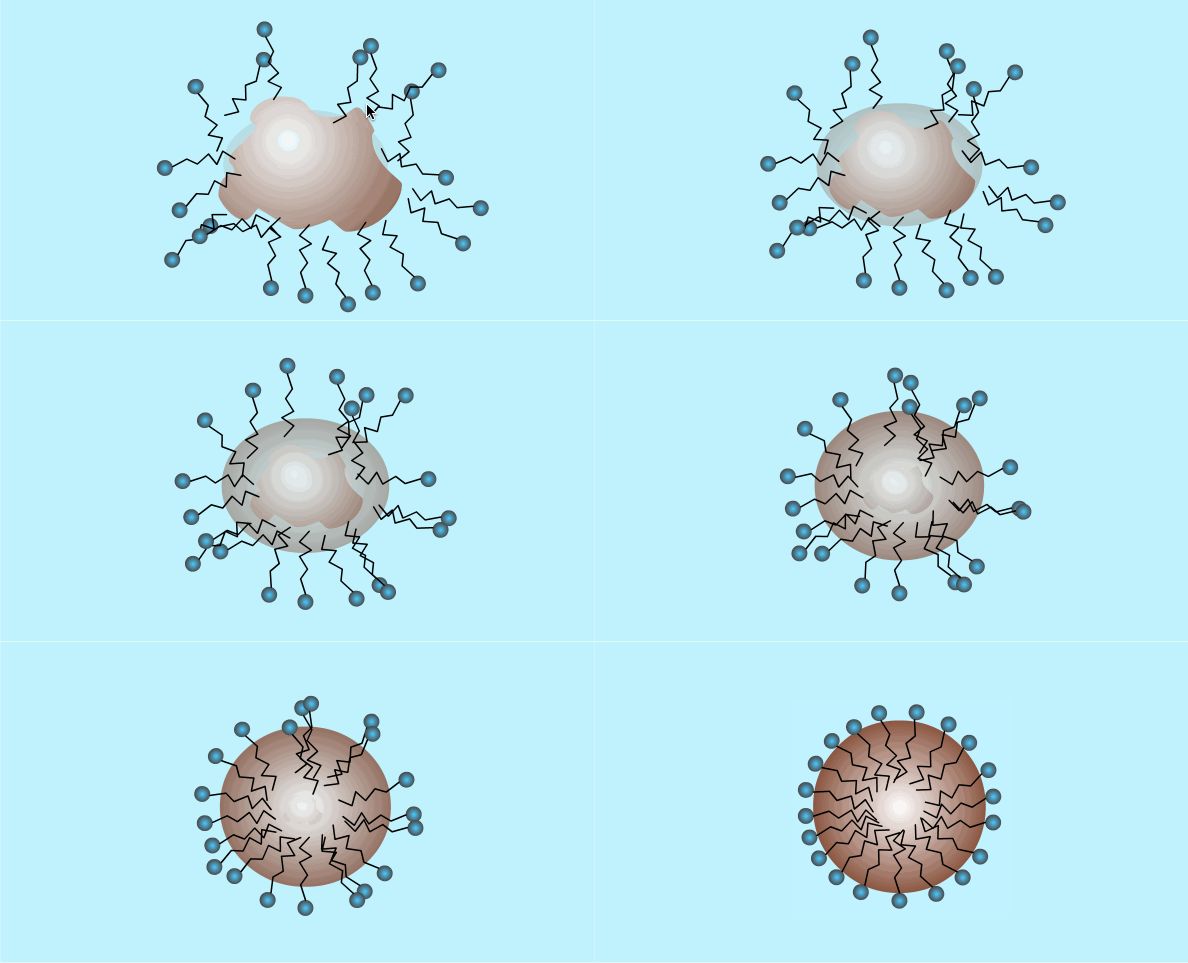
Foundation for Advancement in Conservation. “Soaps, Surfactants, and Detergents” (2008).

ResearchGate – “Schematic representation of surfactant behavior at the water-oil interface.”
Part I. 3D CAD Modeling
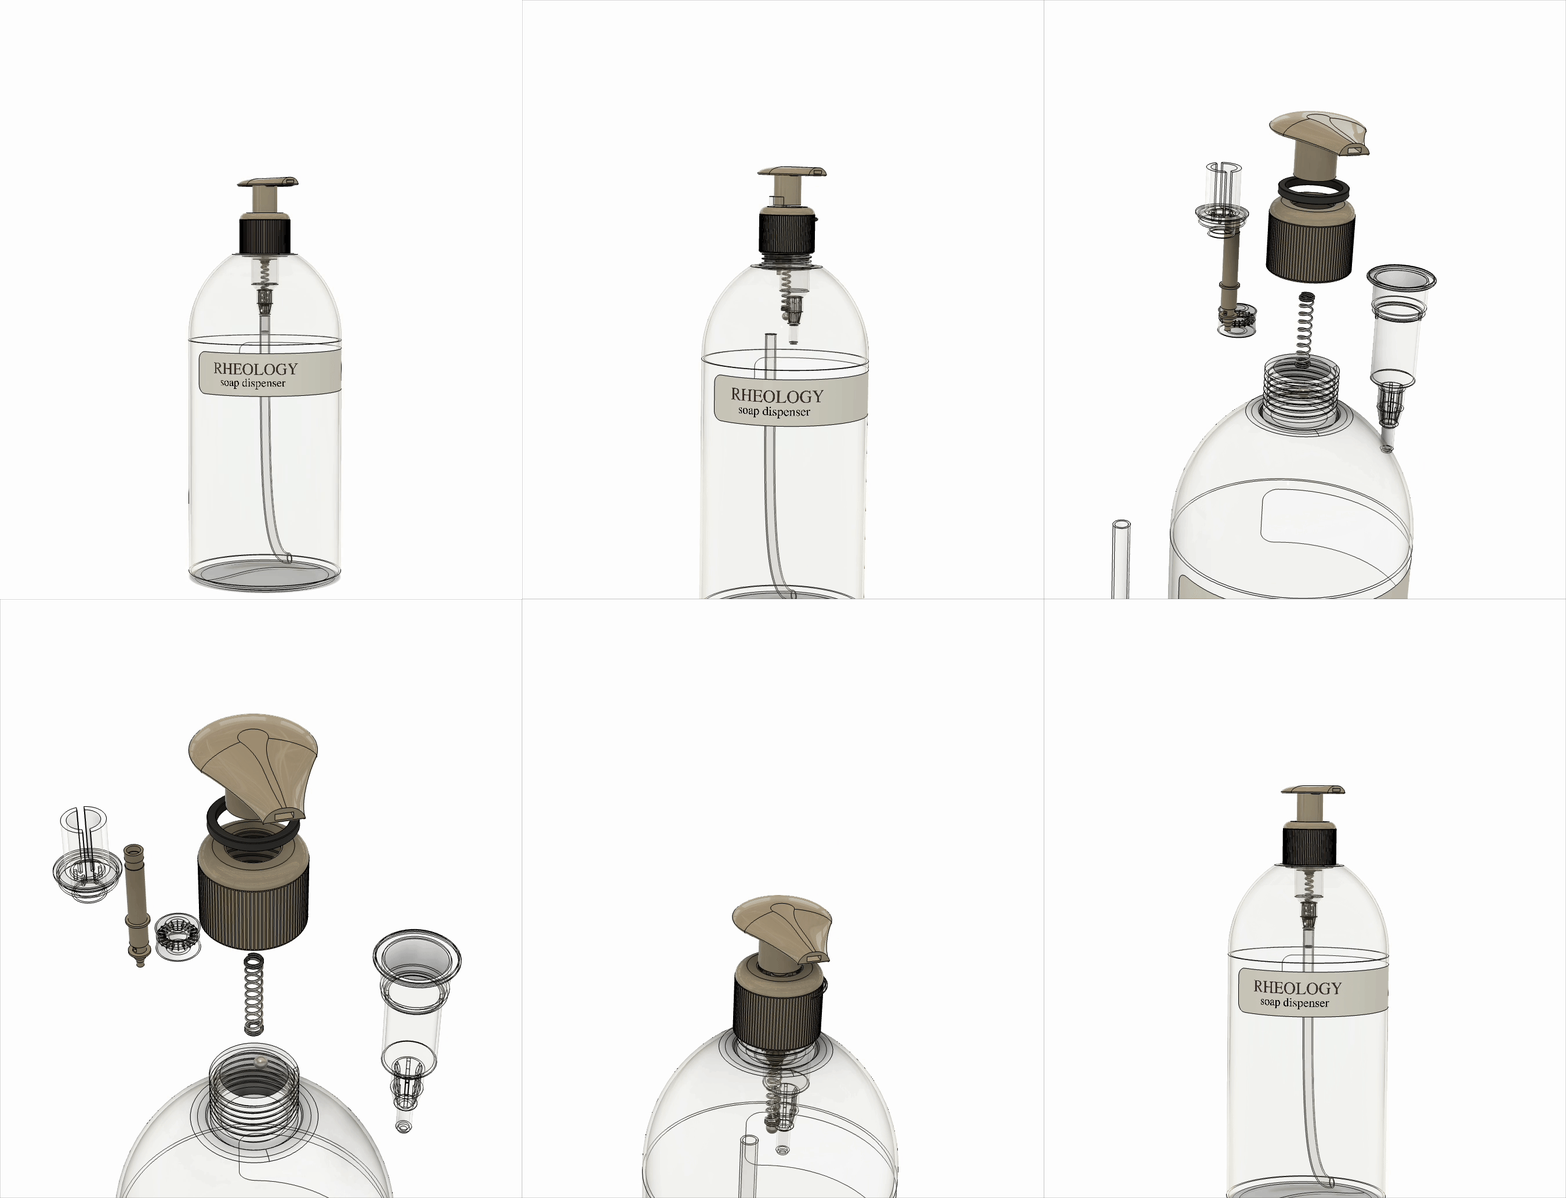
Modeled soap dispenser in SolidWorks entirely from scratch with 11 different components, inspired by existing designs (used this specific CAD model to conduct CFD analysis)


Rendering in KeyShot
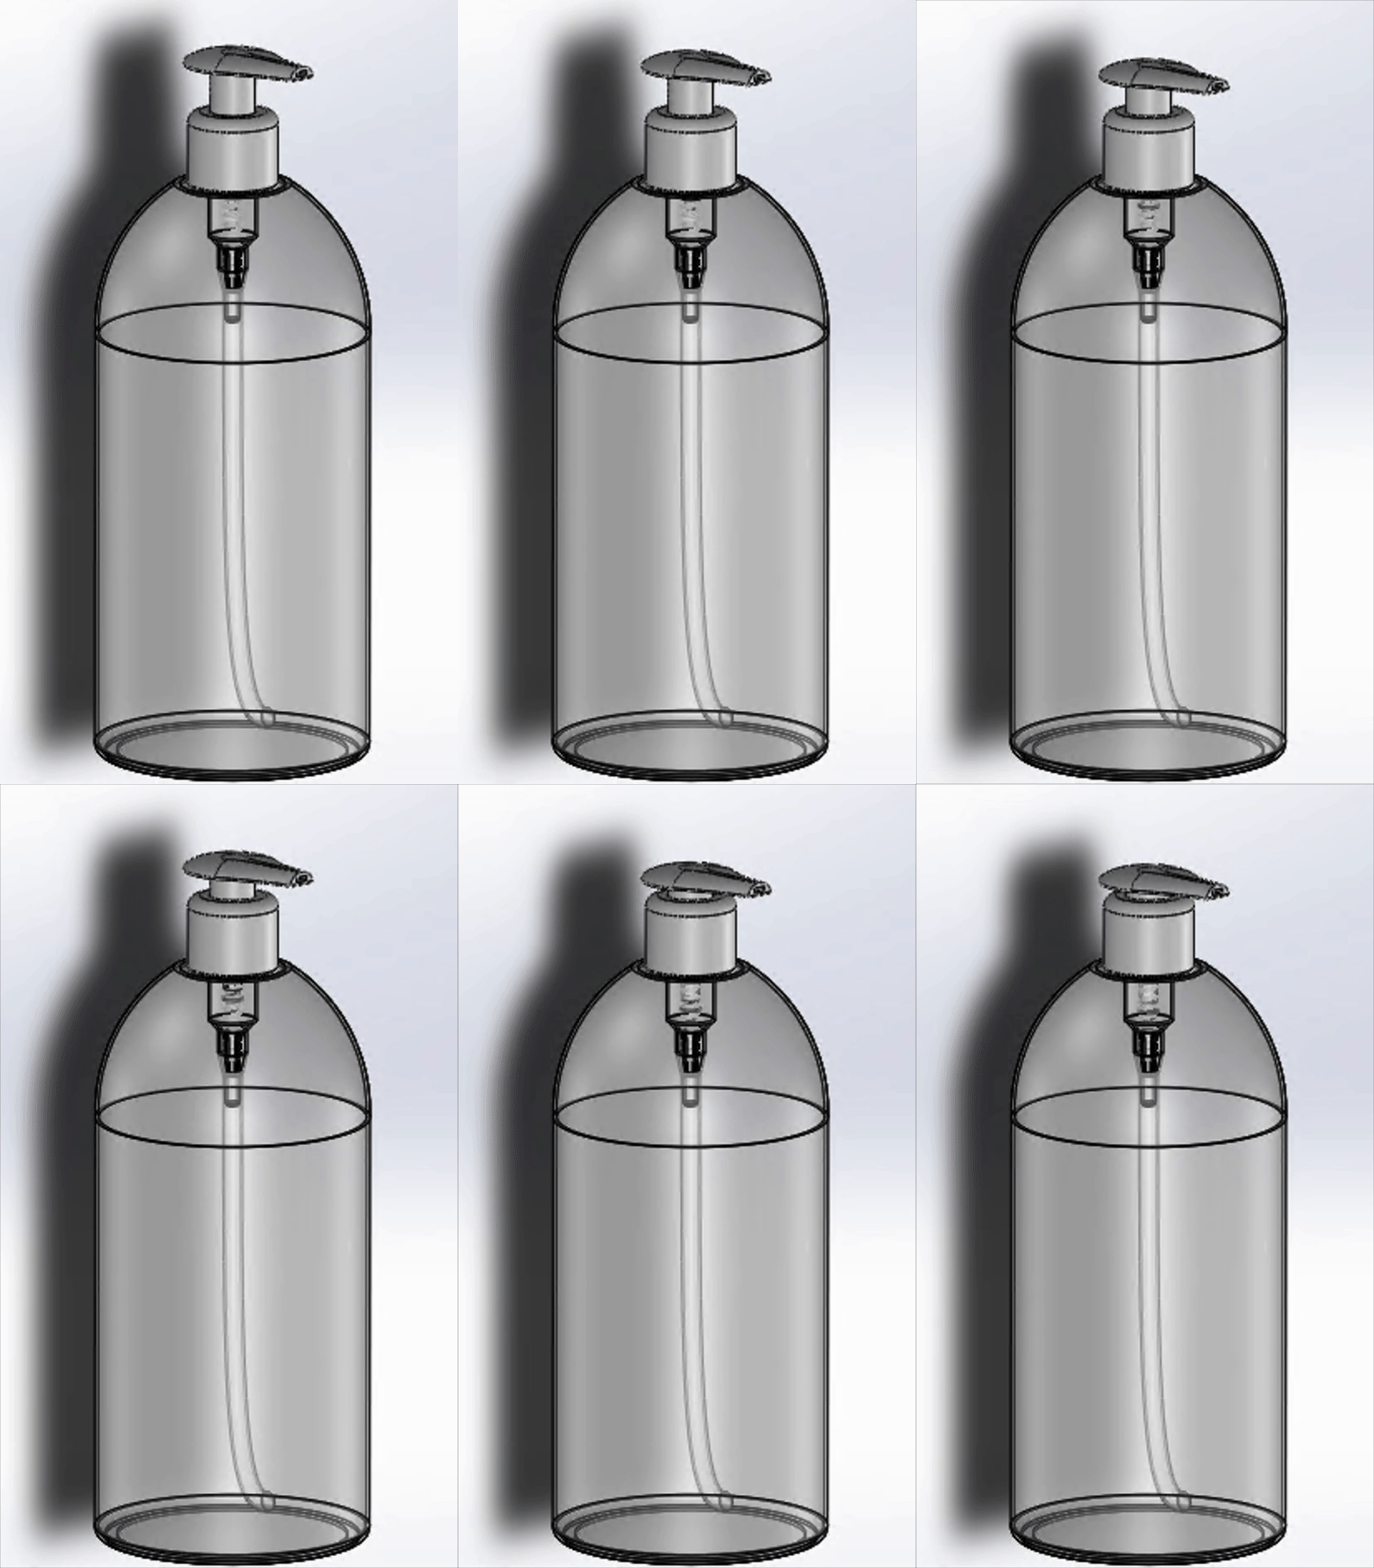
3D Animation in SolidWorks
3D Animation in Autodesk Fusion
Part II. Rheometer Testing

Modern-day RSO Oscillatory Rheometer


Capillary tube viscometer
Commercial rotational viscometer

Saybolt viscometer
Early viscometers (ancestor of the rheometer)
Identified three different liquid soaps with varying material properties:

1. Aesop
2. Meyer's


3. Method
Visited the lab to run a steady shear sweep on the rheometer:

Gross Hall Laboratory
TRIOS Software: Viscosity vs. Shear Rate

Aesop sample
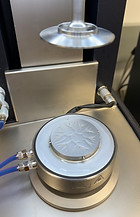
Meyer's sample


Method (not pictured)
Results: Rheometer Data


Part III. CFD Analysis: SolidWorks Flow Simulation
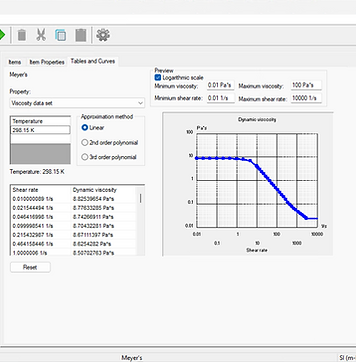
Inputted Dynamic Viscosity vs. Shear Rate values from rheometer data into SolidWorks to create unique material profiles for each soap:
Aesop

Meyer's
Method

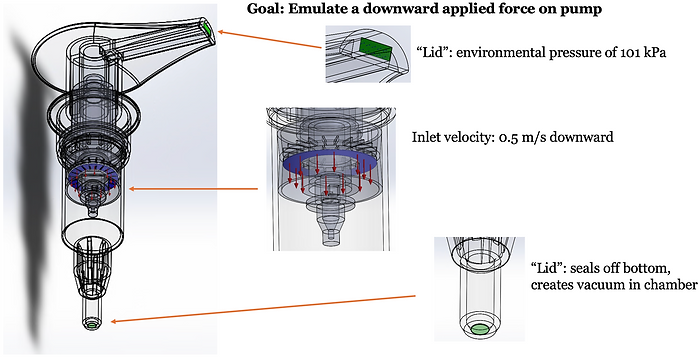
Set up boundary conditions for CAD model in Flow Simulation to replicate fluid flow during pump actuation:
Flow Simulation Boundary Conditions
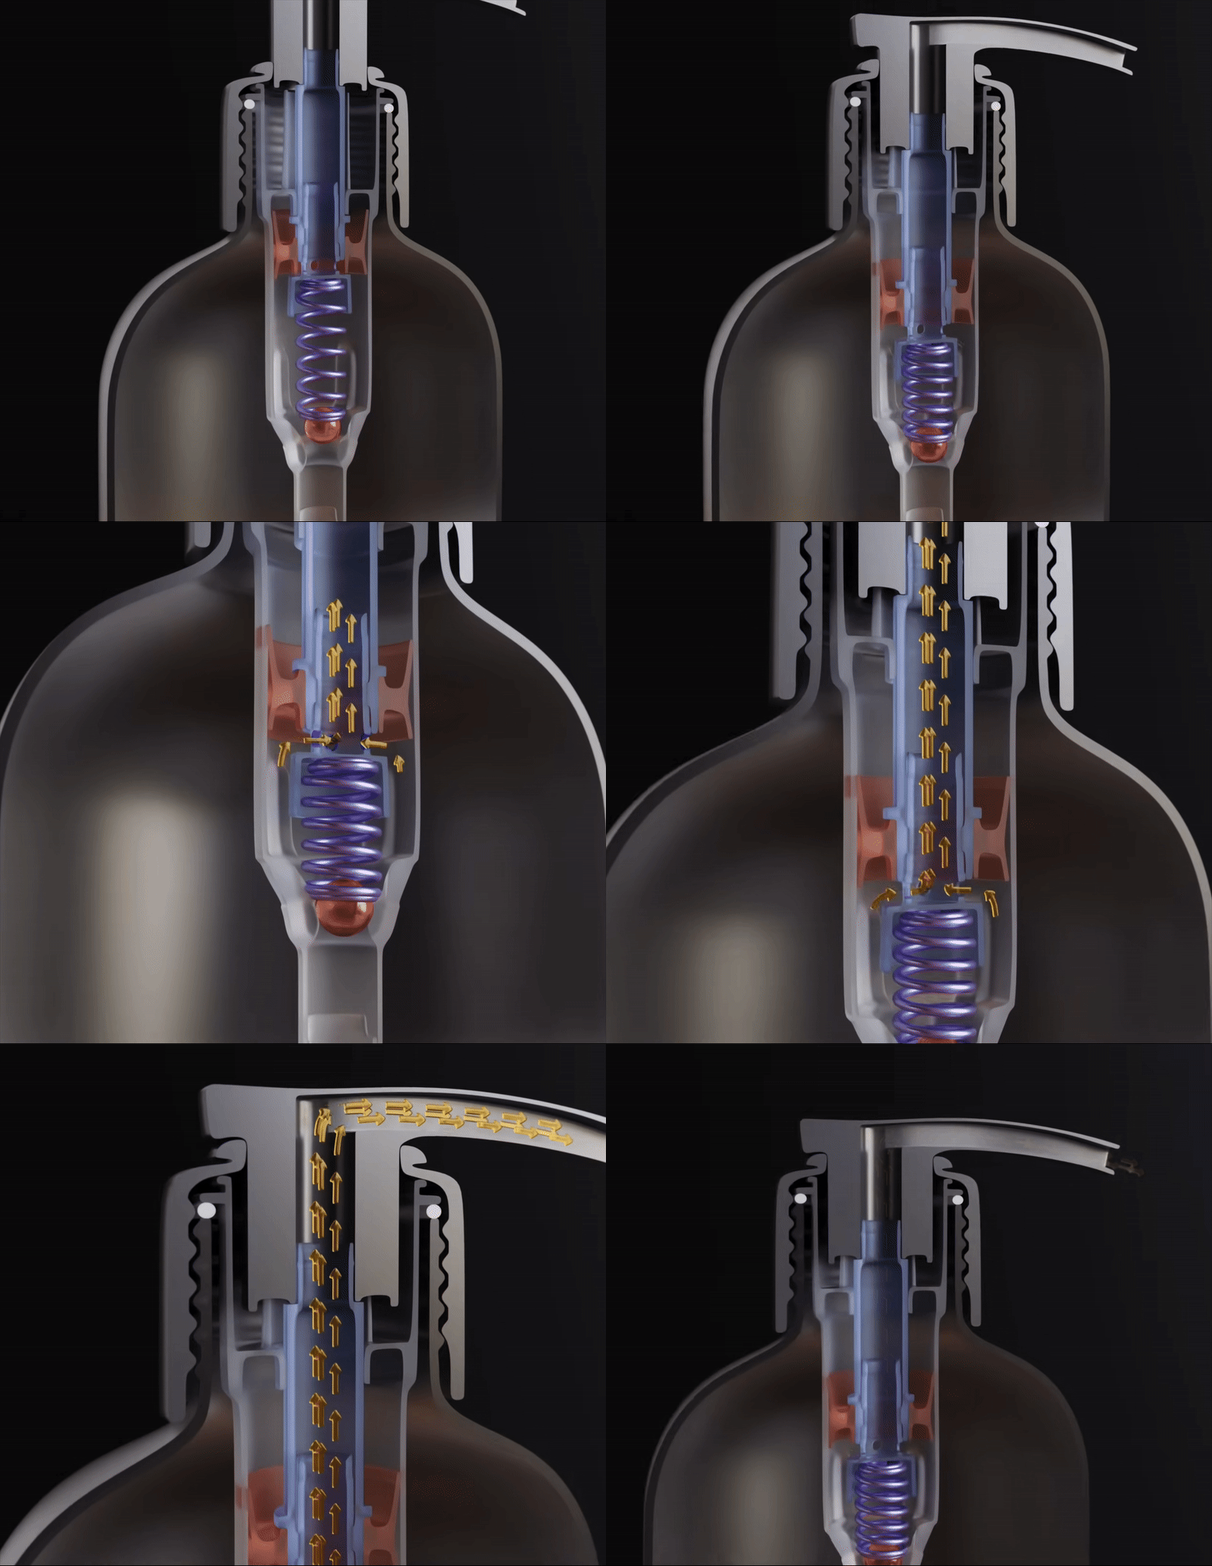
YouTube - “How Soap Bottle Pumps Work"
Results: SolidWorks Flow Simulation
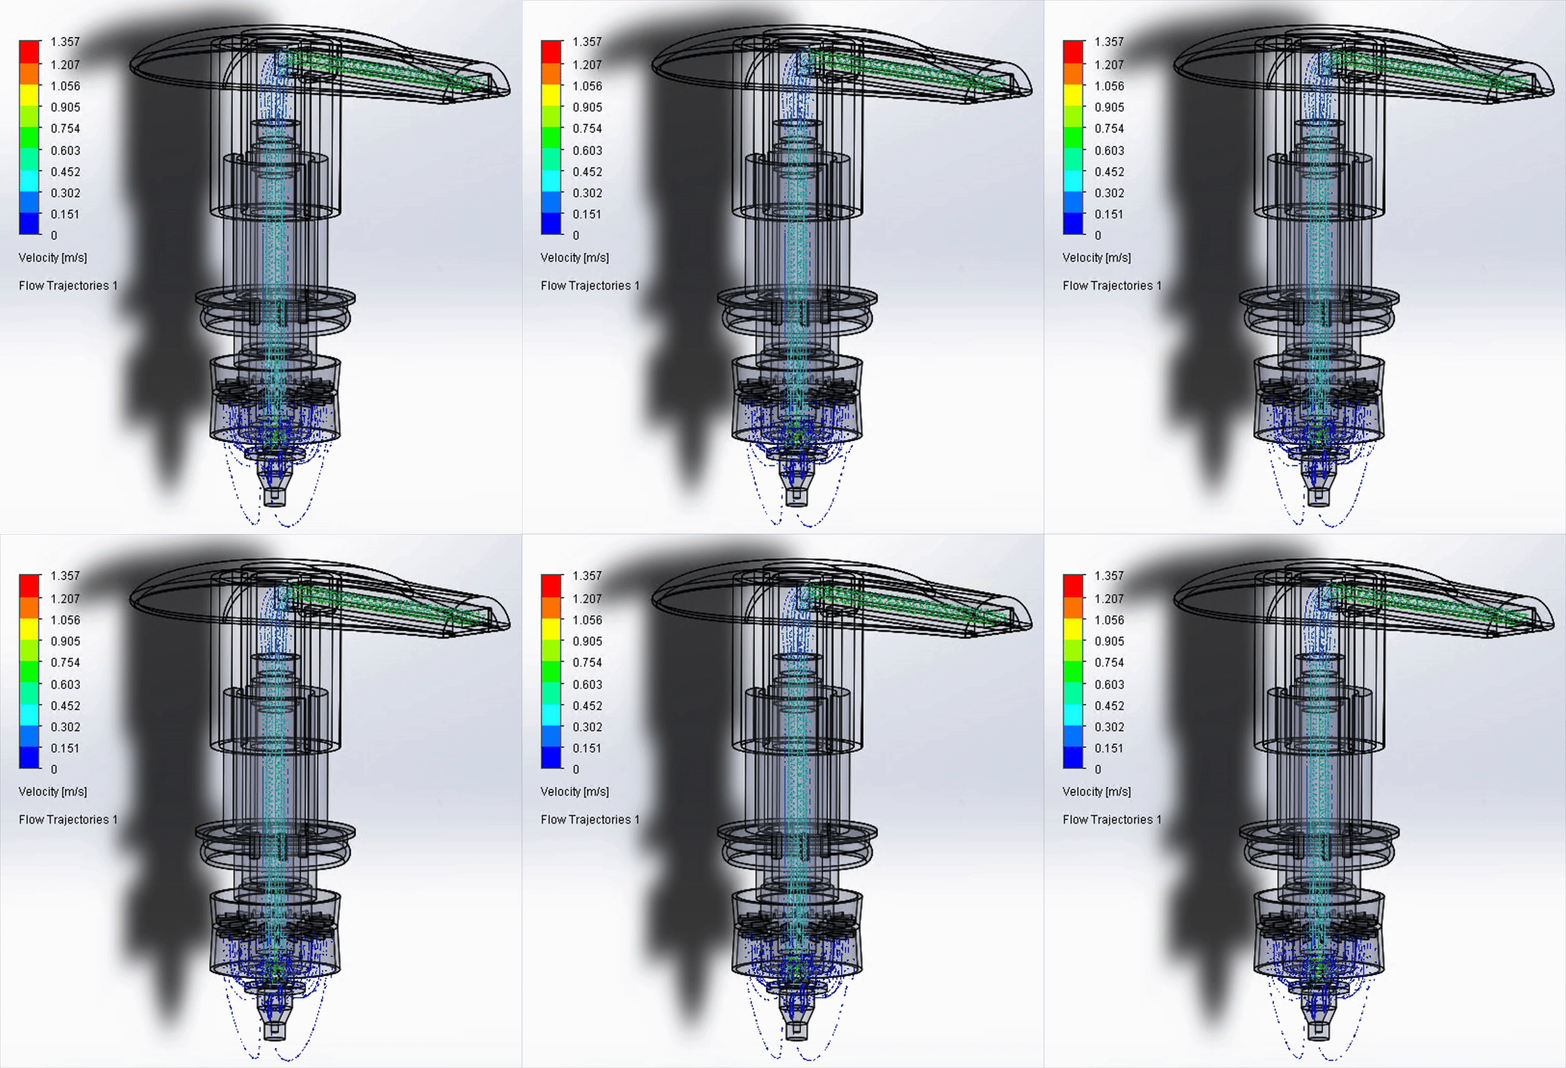
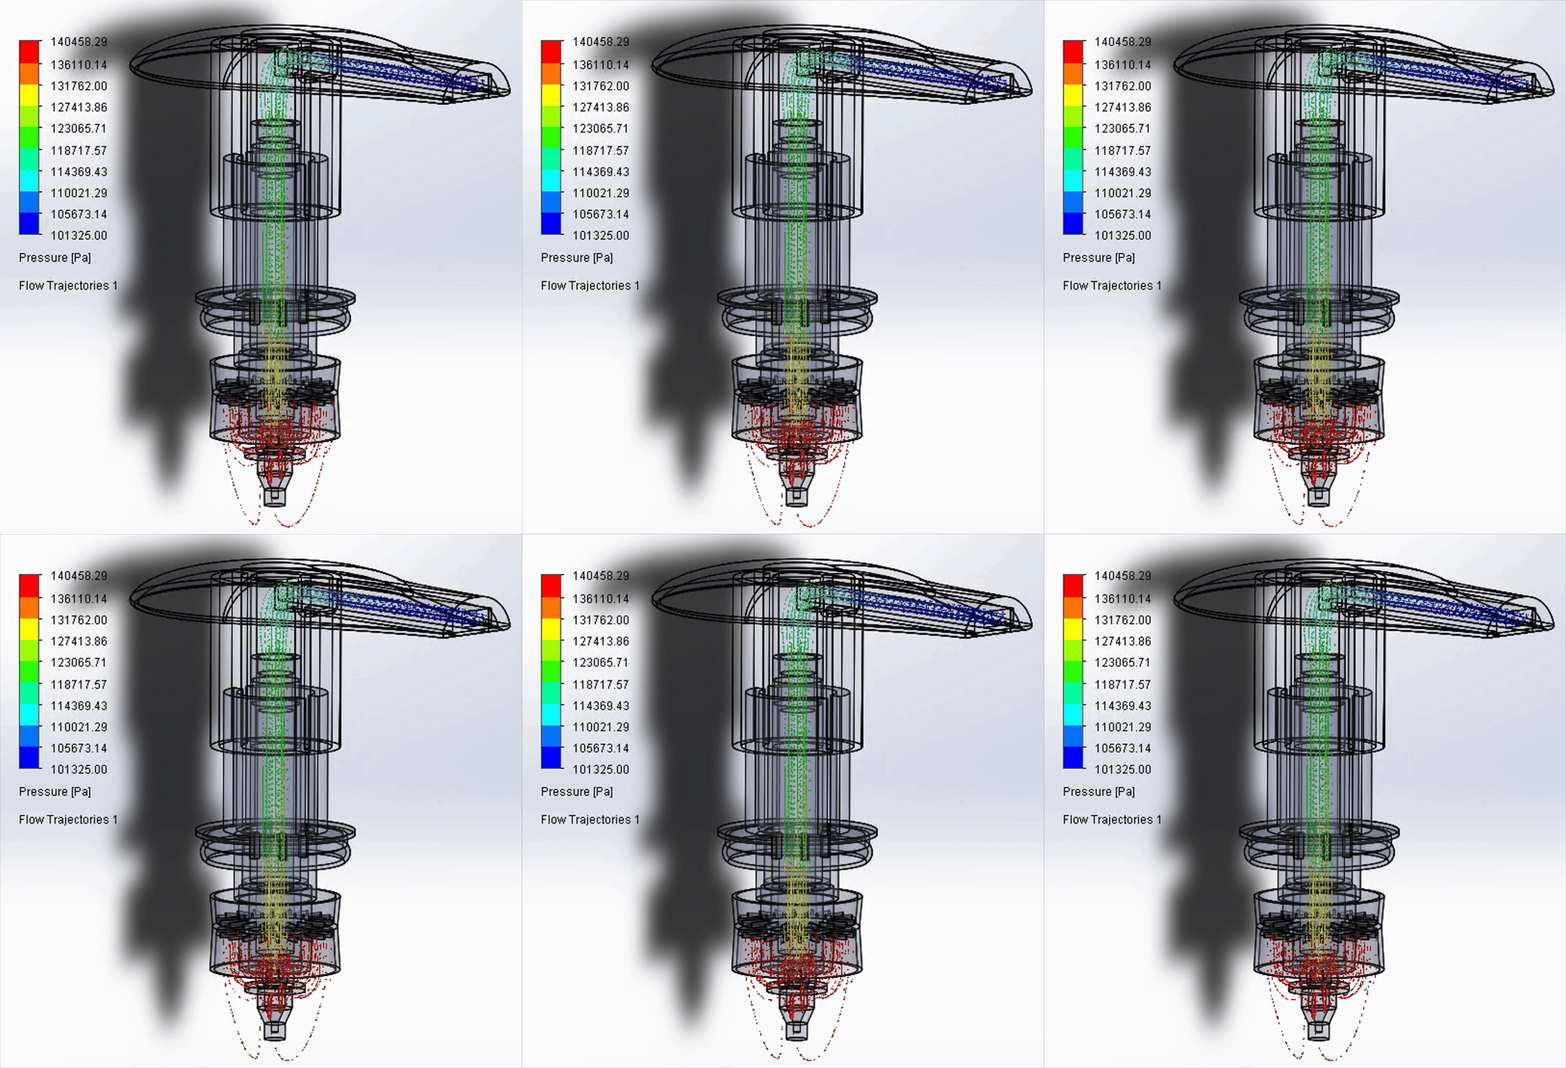
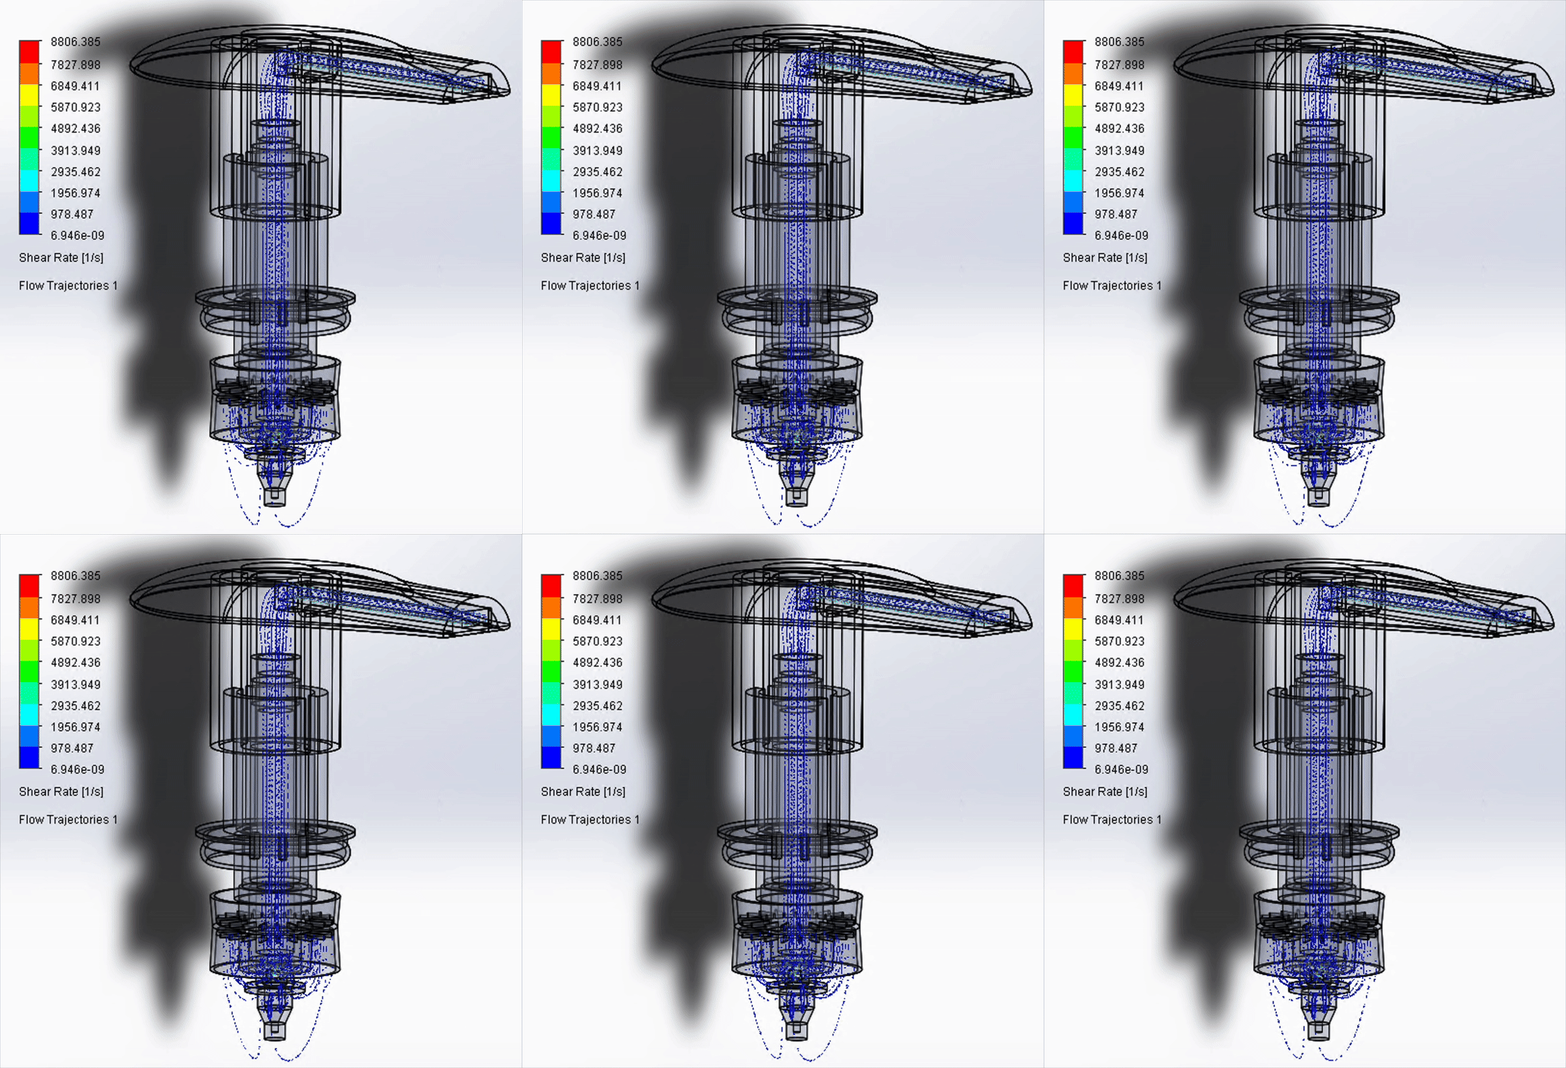
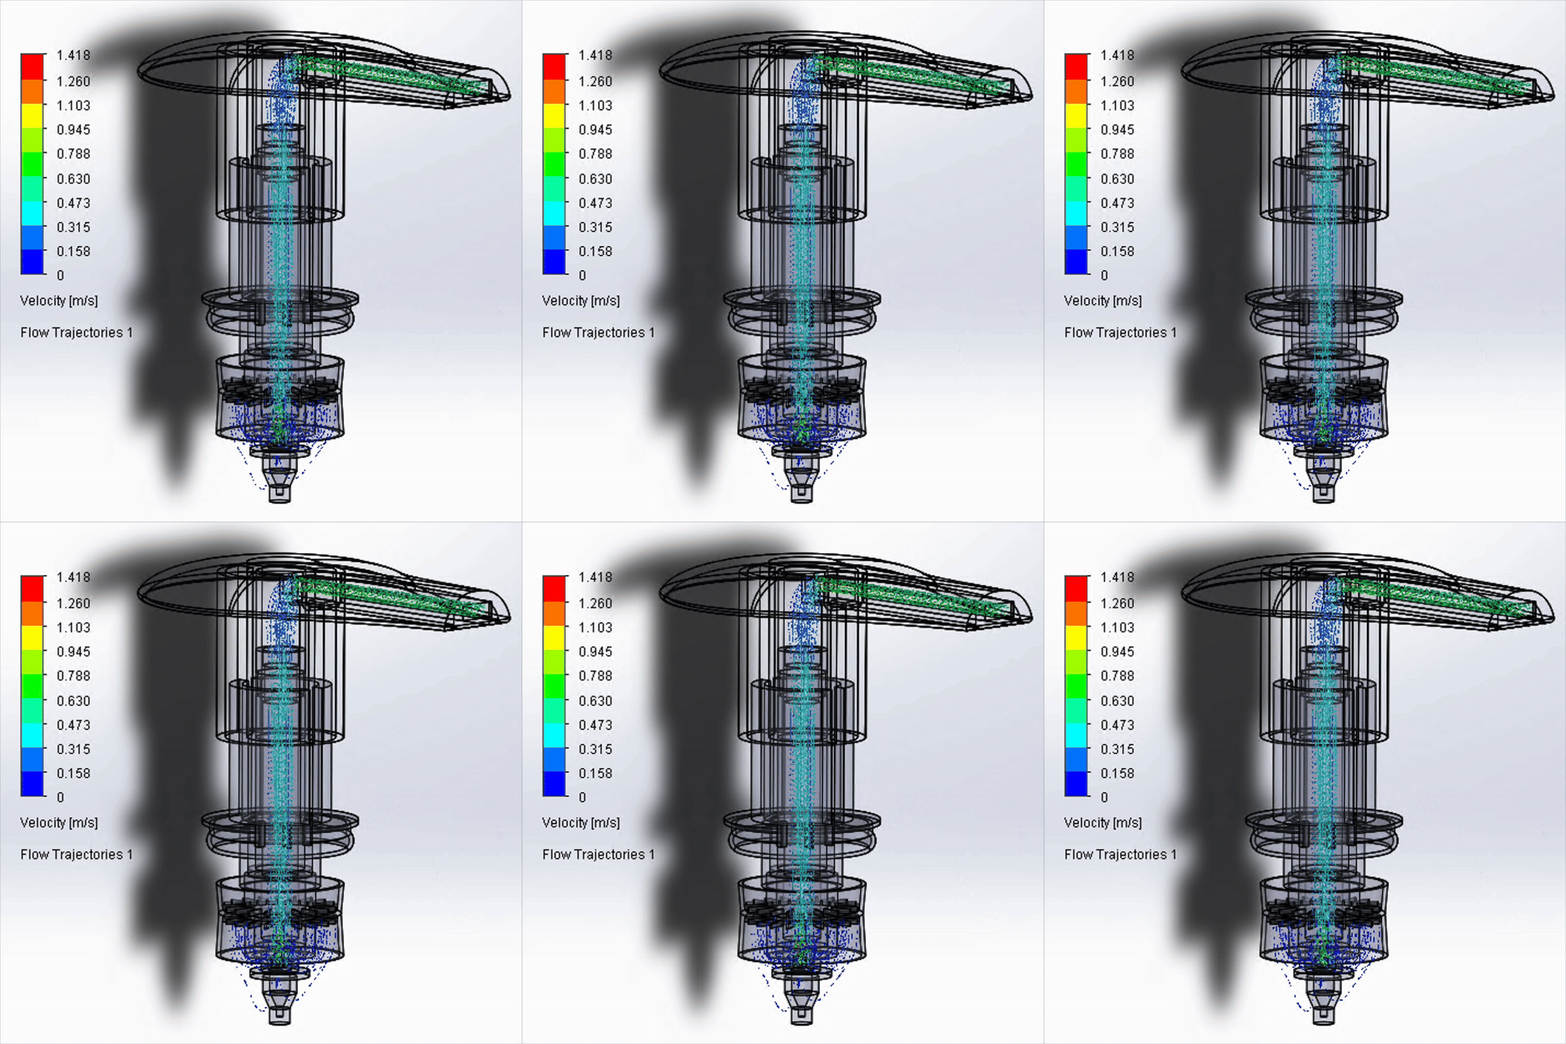
Soap Brand vs. Flow Distribution
Velocity
Aesop
Pressure
Dynamic Viscosity
Shear Rate
Meyer's
Method
Comparative Analysis
Actuation Force Calculation
Calculated the fluid force for each soap using pressure distribution results and cross-sectional area of piston from CAD model:


Piston Area
Calculated the total actuation force (force exerted by user for a downward pump push) for each soap:

Conclusion


Fit for CAD Soap Dispenser?

Summary of Results


bottom of page